Advocacy Campaign Report
Week of November 14, 2022
Thank you for your interest in this pro-DRS advocacy campaign. This is the fourth weekly report for the 2022 Q4 advocacy campaign.
Some helpful keywords and terms to frame this information are below:
-
Impressions: ad views; number of times the ads are displayed on device screens. Does not reflect unique number of people who saw the ads.
-
CPM: Cost Per 1,000 Impressions - a primary advertising cost metric.
-
CPC: Cost Per Click.
-
CTR: Click-Through Rate - the rate at which people saw the ads and subsequently clicked on them.
-
KPIs: Key Performance Indicators - these include the terms listed above and are basic gauges for measuring campaign progress.
-
WoW: Week over Week - refers to changes in performance metrics from one week to the next.
-
All currency is listed in U.S. dollars.
Executive Summary
The ads in the fourth week of the campaign showed slightly lower performance week over week, driving 1,339 site visits (6% decrease) at a cost of $1.23 per site visit (6% increase):

Week over week, spend stayed the same; impressions decreased by 10%, average CPM increased by 12%, while clicks decreased by 25%, and CTR decreased by 17%.
Fluctuations like this are to be expected regardless of whether the budget remains unchanged, and the overall campaign is still achieving healthy measurements.
Total site traffic also declined slightly, seeing a 9% WoW decrease in unique visitors. This is the result of less traffic from direct visits, organic searches, and organic social referrals versus the previous week.
In spite of this, return visitors increased by 3% WoW, largely as a result of traffic driven by the ads. This is another signal that the ads continue reaching the right audience, even when total weekly traffic drops slightly.
Meta Performance
(Facebook and Instagram)
Meta performance continued positive acceleration going through the fourth week of the campaign. Site visits increased by 71% (from 41 to 70 WoW), delivering at a 42% lower cost per site visit (down from $7.96 to $4.66 WoW). This is phenomenal progress given the performance from week one, delivering a cost of $38.88 per site visit:

Total impressions served decreased yet again, but this week by only 15%. Given that total spend remains consistent week to week, this resulted in the CPM continuing an upward climb. However, clicks and CTR both continue to increase, while CPC continues to drop, all positive signals.
Ultimately, the inverse relationship seen on Meta so far between CPM and cost per site visit (where the cost for ad views continue to rise while the cost per site visit decreases), indicates that the Meta ads are being well-optimized for delivery to the appropriate audience.
Grandma’s Recipe (see ad previews here) continues to be the highest performing ad in driving the most site visits through week four, delivering 62 of the 70 total for the week from Meta. The CTR for this ad rose nominally from 5.19% to 5.26% WoW. But when broken down by age and gender, surprisingly, men ages 45-54 drove the highest CTR of 10.39% for this ad in week four.
Twitter Performance
Twitter’s performance in week four broke the positive trends that had been sustained in weeks one through three, albeit slightly. Total site visits decreased by 8% (from 1,380 to 1,269 WoW), while cost per site visit increased by 9% (from $0.96 to $1.04 WoW):
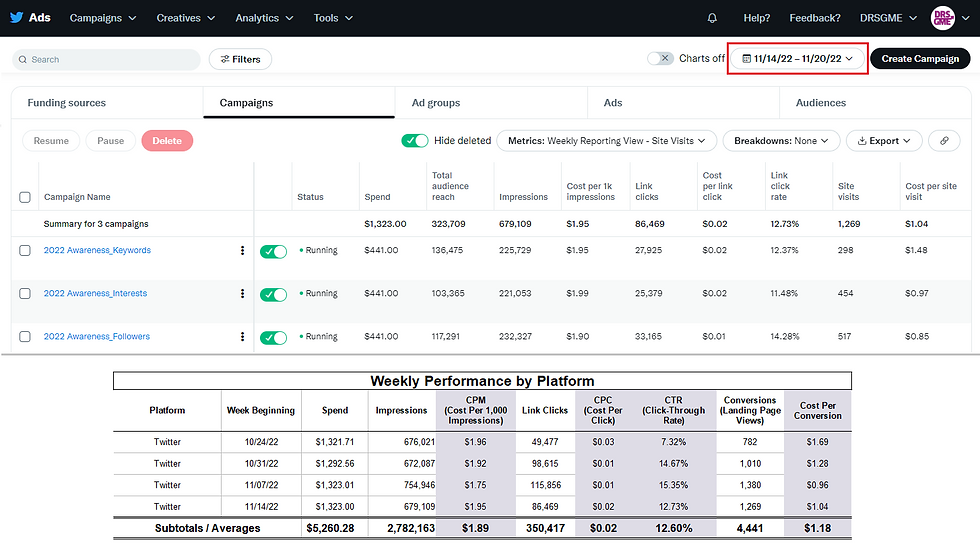
Spend remained consistent, while total impressions served and CPM returned to levels seen in weeks one and two. Clicks decreased by 25% week over week and CTR decreased by 17%, both to levels slightly lower than from week two.
This type of weekly change is normal, given that both the total site visits are higher and the cost per site visit is lower than what was delivered in weeks one and two, the performance from week four is still encouraging.
The top three ads driving the most site visits this week were Ringo, Seedling, and the carousel ad featuring Couch Man, Seedling, and Grandma’s Recipe (see ad previews here).
Sweden and France continued to be the top two countries delivering the most site visits for the week. However, their combined total dropped from 57% to 49% of all site visits week over week, while users in Belgium drove a WoW increase from 9% to 13% of total site visits from the Twitter ads.
Site Activity
Total site traffic from all sources declined this week, with the biggest shifts in weekly traffic coming from Direct, Organic Search, and Organic Social. Traffic driven by the ads started out strong at the beginning of week four, with the most site visits driven by the ads for the entirety of the campaign seen on Monday, November 14. Thereafter, daily unique visitors from the ads declined to an average of what was seen in week three:

Unsurprisingly, unique return visitors also declined during week four. Though, total weekly unique return visitors driven by the ads was still 11% higher WoW, reaching a peak on November 15:

Fidelity and IBKR continue to be the broker guides receiving the most views and visits. However, Revolut (broker headquartered in London) received more visits this week than it has in more than three months. Week over week, unique visitors almost doubled (from 182 to 349):

Conclusion and Next Steps
It is apparent that external events relevant to the market have an impact on direct, organic search, and organic social traffic to the site. Echoing from last week’s report, the news around the FTX collapse was a major factor driving more visitors in week three, and explains the decline in traffic from those sources in week four.
Though, even with a slight decline in traffic, an increase in unique return visitors driven by the ads is a positive signal. In addition to the above, all of this indicates that the site is successfully reaching people through one medium or another.
Regarding activity around specific broker guides, the spike in views of the Revolut guide may be explained by the fact that Revolut's U.S. broker (DriveWealth) changed how they process DRS requests from their customers. They deactivated the contact email address that was being used for this process, and subsequently directed people to use an online portal, instead.
It is suspected that Revolut may have done this either to make their internal process easier, and/or to aggregate and track more data from people who request a DRS transfer. Thanks to the incredible community at large that supports DRSGME - messaging through channels like the r/DRSyourGME subreddit, direct email, and the contact form here on the site - this was discovered the same week the change occurred and the guide here on the site was updated accordingly.
Finally, DRSGME continues to see commentary from Reddit users who are interested in directly registering their GME investment yet are still not aware of the broker guides available here to ease them through the process. Reddit was initially excluded as an advertising vehicle for this campaign, largely because historic performance of Reddit ads in general is poor compared to other digital ad platforms. There is also a high saturation of Reddit users both invested in GME and already aware of the DRS.
However, as DRSGME continues to field questions from and provide support to Reddit users new to the site and its resources, Reddit ads are being added to the mix beginning in week five. Details on the performance for the first week on Reddit will be included in next week’s report, for the week beginning November 21.